Applications: In Johannesburg, meter-scale urban heat modeling showed historically marginalized neighborhoods such as Soweto set to experience 100-120 hot nights per year by 2050 (nearly three times as many as in leafy residential neighborhoods), together with an expected doubling of heat-related excess mortality.
Data requirement: Global data with option to incorporate local data
Final deliverables: The report includes quantifying current and future heat exposure and its economic impacts through health costs, reduced labor productivity, and infrastructure costs. Mapped variables include mean daytime temperature, number of heatwave days/nights per year, and cooling degree days. The analysis also identifies key sectoral impacts, such as projected changes in heat-related excess mortality and labor productivity.
Geographic scope: City-level
Hazards covered: Heat stress
Indicative Cost / working time: $14k
Time Required for delivery: 2 months
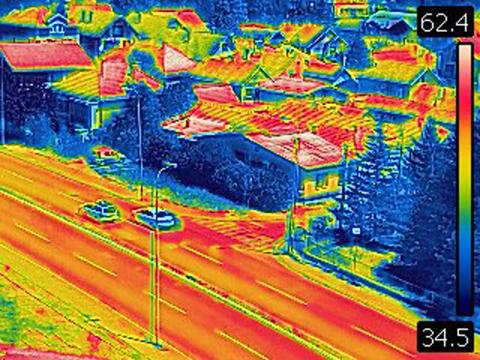
Increased heat exposure is driving economic impacts through three channels: health costs, reduced labor productivity, and infrastructure costs. This assessment quantifies current and future heat exposure through climate modeling and/or field observations. Outputs include spatially explicit heat maps for present-day, mid-century, and late-century periods under selected climate change scenarios (e.g., SSP1-2.6, SSP3-7.0). Variables mapped can include mean daytime temperature, number of heatwave days/nights per year, and cooling degree days (a proxy for energy demand for air conditioning). The analysis includes identification of key sectoral impacts (eg. projected change in heat-related excess mortality and labor productivity impacts).
