Applications: Detailed understanding of inter- and intra-city temperature differences across a city and underlying physical and socioeconomic drivers in differences, as well as stronger engagement with local communities and officials with buy-in for action.
Data requirement: None - data collected locally
Final deliverables: Final deliverables include the full set of collected data, heat and air quality route maps and city-wide and neighborhood maps, as well as an online StoryMap report of the city "Heat Watch," with interactive materials from the campaign and explaining the data and the findings. See an example here: https://storymaps.arcgis.com/stories/cae76ed8572747ada2a52bd9c0c39cde. Also delivered are photos and videos from the campaign. This can be paired with capacity-building workshops on the topic to disseminate findings further and inculcate action planning in city officials, as has been done in South Africa.
Geographic scope: City- and neighorhood-level
Hazards covered: Heat, air pollution
Indicative Cost / working time: $40k
Time Required for delivery: 3 months
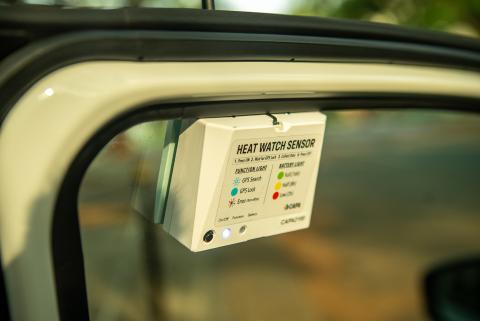
The community-driven citizen science campaigns recruit local participants from NGOs and/or universities, provide them with advanced scientific sensor equipment, and design a methodology to capture urban heat and/or air pollution conditions at different times of day through multiple vehicle traverses, according to predefined routes, via cars, motorbikes, bicycles, etc. The collected data are analyzed to develop route maps and overall city and neighborhood maps of heat disparity, while building awareness and momentum for action on heat mitigation and air pollution with clients, community leaders, and residents.