Applications: Recent applications include Peru (P163255), Manila (P171419), and Colombia (P180534)
Data requirement: Global data with option (strongly recommended) to incorporate local data to improve model precision
Final deliverables: A GIS layer containing all relevant data, complemented by a csv data set and a slide deck containing key messages and highlights. A written report can be produced based on needs
Geographic scope: National, subnational, cencus blocks
Hazards covered: Multiple hazards
Indicative Cost / working time: $75k-$100k
Methodology peer-reviewed, cleared (date)?: Yes - peer reviewed and published in Nature 06/23
Time Required for delivery: 3-5 months
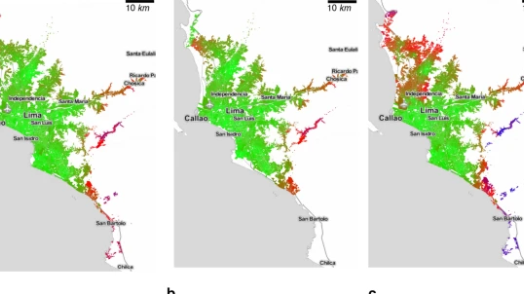
The analysis models accessibility to health facilities by combining data on health facility locations, population density, travel speed, and risk exposure. In a first step, the model estimates hazard exposures of the population, and health and transport infrastructure. In a second step, average travel times are estimated for a “business as usual” scenario and for disrupted scenarios where natural disasters impact roadways and health facilities. The results of the analysis identify underserved areas where people need the longest time to reach any health services and where access changes during disasters. Unlike previous accessibility models, this tool not only estimates the travel time to the closest facility, but rather the average travel time to any facility. This is a more realistic estimate of access to health services, as people in urban areas often do not choose the closest health facility.