Applications: Interactive sessions (e.g., workshops) focusing on one city or comparing multiple cities; temporary or permanent web platform to showcase and provide access to data related to hazards, climate, population, geography, economy, etc.
Data requirement: Global data with option to include local data.
Final deliverables: The output is a guided interactive web platform and interactive sessions (e.g., workshops) that focus on one city or compare multiple cities. It showcases and provides access to data related to hazards, climate, population, geography, economy, and more. The platform engages users with both hazard and non-hazard data, helping them understand city resilience and climate challenges. It includes maps, graphs, statistics, and qualitative analysis, and allows for customization to enhance urban development insights.
Geographic scope: City-level
Hazards covered: Floods, sea level rise, coastal erosion, heat, air pollution, landslide, drought, and extreme weather events
Indicative Cost / working time: $500 - $9k
Time Required for delivery: 2-3 weeks
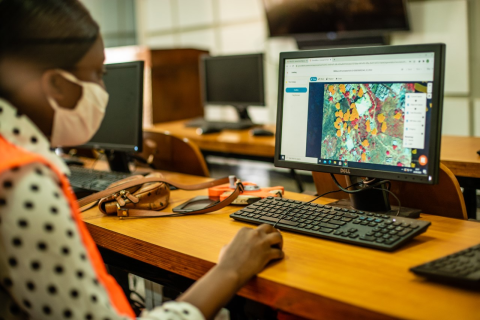
The Spatial Data Layers Viewer provides an interactive web platform for the audience to engage more deeply with both hazard and non-hazard data, so that they can gain a deeper understanding of the city’s resilience & climate challenges and draw their own conclusions about urban development priorities. The Viewer is intended to build upon existing geospatial or quantitative analysis and accommodates a wide range of mediums, including maps, graphs, statistics, and qualitative analysis. It is designed for rapid deployment by using an existing template, but it is simultaneously flexible enough for any customizations to help strengthen the narrative.